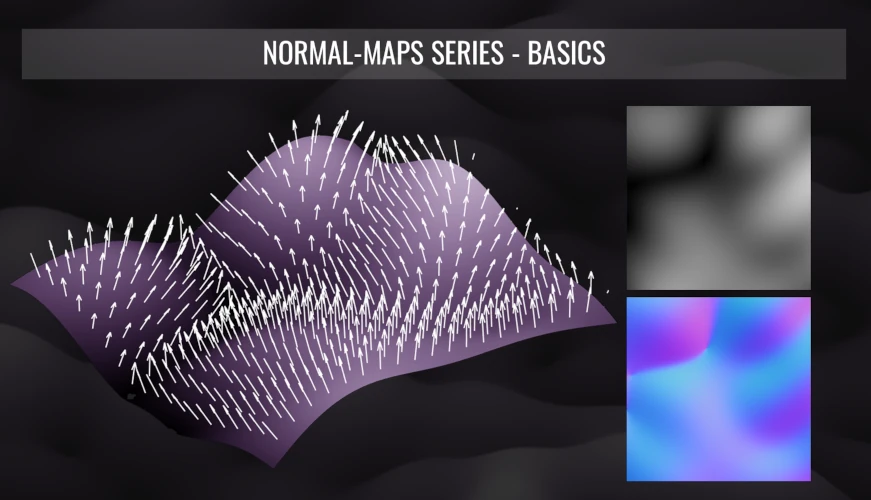
This article is the first of a group of three that will discuss normal-maps and our measurement results compared to common methods proposed which use different softwares and tutorials (nVidia Texture Tool, Gimp, Photoshop, xNormal, AwesomeBump, ….). If you’re familiar with the concept of height-maps and normal-maps, you may still be interested in the two following.
Normal vector
The term “normal” is a mathematical term that means “perpendicular”. A normal vector is a vector perpendicular to the tangent line of a curve in 2D or a to the tangent plane of surface in 3D. The useful informations of a normal vector are its origin on the object and its direction and its norm (= its length) is taken as 1 by convention. In the illustration below, red arrows are normal vectors to the circle or to the ellipsoidal shape.
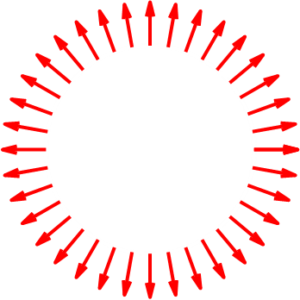
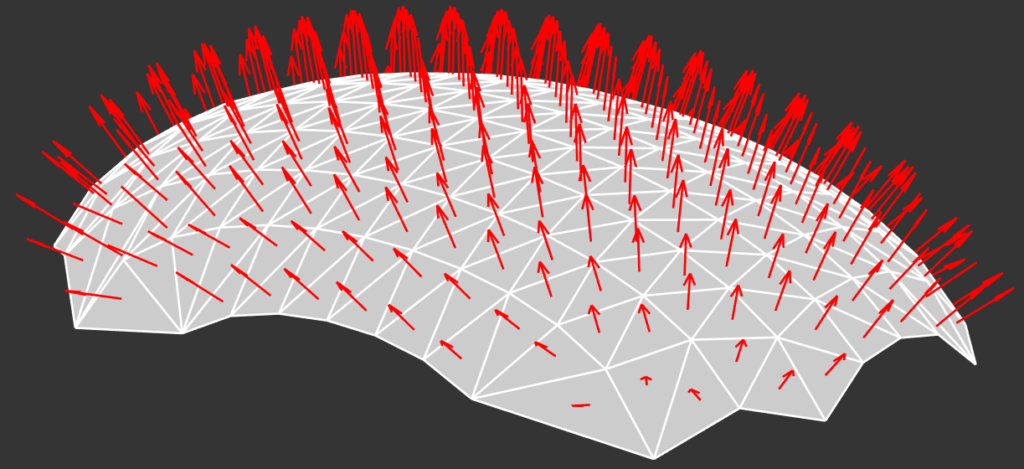
In the case of image rendering, we’re interested in objects surfaces and the image above illustrates how local normal vectors directions are related to the local shape. The normal vector is used to calculate the angle of incidence of light with the surface which is needed to determine the quantity of light that’s reflected or transmitted in each direction.
Height-map
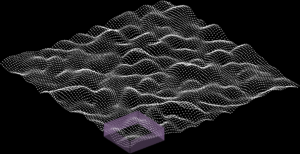
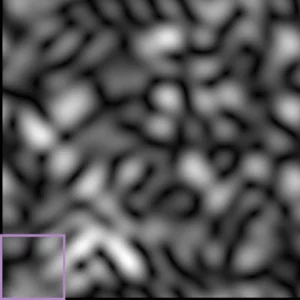
Let’s consider a surface that’s flat in average but with a slightly rough texture. On the illustration below, the color represents the height of the surface from black (minimum height hmin) to white (maximum height hmax). The height is a function of the (x,y) coordinates.
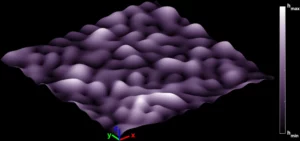
The two steps to obtain a height-map from a given surface are sampling and quantization. The sampling consists of creating a regularly-spaced grid of points in the (x,y) plane and calculating for each point its height value h(x,y). Then, the quantization is the process that transforms these continuous values into a finite set of integer values.
For an 8-bits precision image, only 256 values are permitted from 0 to 255 included. One possible and very straightforward transform from heights h to quantized values Q is the affine transform Q = round(28(h-hmin)/(hmax-hmin)). The images below illustrate the principle of sampling the surface and then displaying the quantized values as a gray-level image. The bottom left of the image corresponds to the bottom corner of the 3D view.
Normal-map
What is sampled to obtain the normal-map of the surface is the coordinates of the normal vectors. The images below shows normal vectors for a gridded sampling of (x,y) coordinate, on the left with their origin are set on the surface and on the right with their origin set on the z=0 plane.
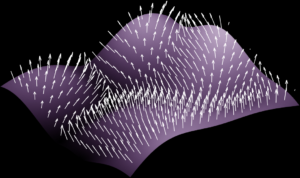
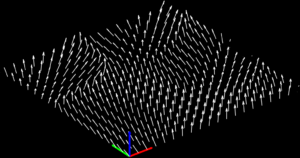
At this step, each point of the sampling grid has a corresponding normal vecotr, thus three corresponding normal vectors coordinates. Since typical RGB images have three values per pixel, it would be convenient to asssociate each sampling point to a pixel and each vector coordinates to a color channel value. In the 3D space (x,y,z), the coordinates of a given normal vector v are between -1 and 1 for the vx and vy coordinates and between 0 and 1 for the vz coordinate, whereas RGB values are generally integers between 0 and 2k-1 for k-bits images (8-bits or 16-bits).
The affine transform C= round(2k-1(1+v)), where C represents the R, G or B and v the coordinate x, y or z coordinate of the vector, is used for the conversion and the continuous segment [-1;1] is quantized within the integer set from 0 to 2k-1. To each vector direction corresponds a color which is shown on the video below. Note that some softwares may have other conventions and flip the direction of either the x-axis. Also, since the z coordinate is always positive, half of the dynamics of the B channel is unused.
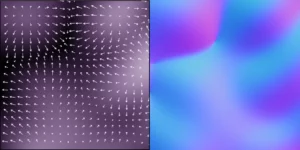
In the case of the surface used in the tutorial, the normal-map is given below. reddish shades corresponds to slopes whose normal vectors have positive x and negative y coordinate, thus pointing downwards right in this convention. Like the height-map, the continuous range of values for the vectors coordinates are quantized on a finite set of 2k values per channel in the case of k-bits images. Also, since the coordinates of the normal vector must correspond to a norm of 1, not all the colors are possible in a normal-map.
Conclusion
Normal-maps and height-maps are regular sampling of data related to a 3D surface considered flat at a large scale. The sampled values are then transformed into values available in typical images formats using simple conversion formulas. The next article will compare our results which are based on physics with softwares that propose to create normal-maps from materials pictures by making strong assumptions and that obtain questionnable results and the final article will deal with the relationship between the two maps and the impact of quantization on the recorded information.
